Lab 5 Flotation
Data:
| \(\mathrm{Cu}\) Grade | \(\mathrm{Cu}\) Recovery | \(\mathrm{SiO}_2\) Rejection | SE |
|---|---|---|---|
| 1.98 | 96.12 | 67.85 | 63.97 |
| 6.89 | 91.70 | 92.53 | 84.23 |
| 2.62 | 96.88 | 75.23 | 72.11 |
| 8.70 | 92.12 | 94.27 | 86.38 |
| 2.95 | 96.97 | 77.03 | 74.00 |
| 9.55 | 92.33 | 94.65 | 86.98 |
Plot 1
For the first plot, plotting the data gives:
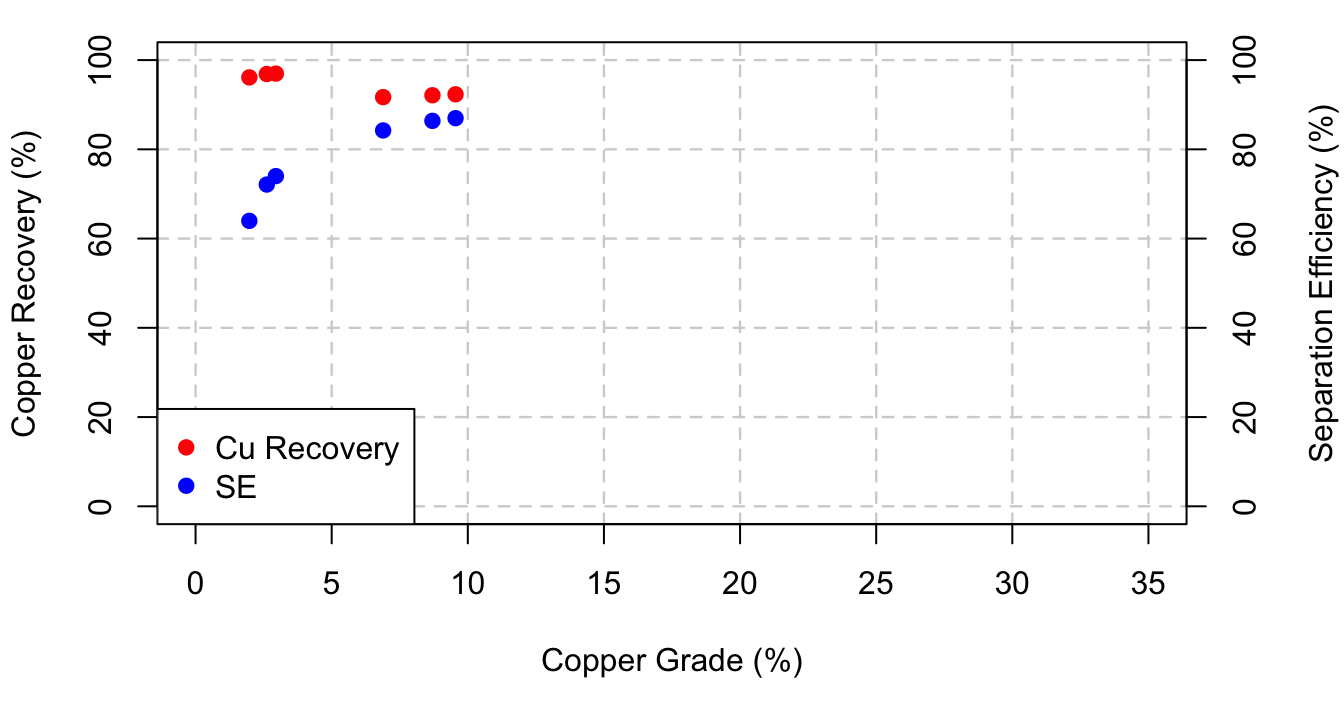
First of all, remember each group ran the same test with the same procedure, the only difference being the two stages in the plant we simulated.
Grade vs. Cu Recovery
We observe that as \(\mathrm{Cu}\) grade increases, recovery decreases. This is consistent with the typical grade recovery curve. If recovery is 100%, the grade has to be the feed grade to the process because it is so difficult to get every single particle into the concentrate. We can never get 100% recovery, we can only asymptotically approach 100% recovery. Similarly, we cannot reach 100% grade. Theoretically, if grade is 100% then recovery approaches 0. 100% grade is like if you had a 10,000 ton pile of of rock with a 100 lb of tiny gold particles in it and you picked one of the gold flakes out with tweezers. You would have a 100% grade concentrate, but practically 0% recovery.
Grade vs. SE
Next we know separation efficiency is calculated as:
\[\begin{equation} \mathrm{SE} = \mathrm{R}_{\mathrm{Cu}} - \mathrm{R}_{\mathrm{SiO}_2}\label{eq:SE} \end{equation}\]
Where \(\mathrm{R}_x\) is the recovery of component \(x\). On the plot, you are seeing that for an increase in grade you are seeing an increase in separation efficiency. In our observed data, recovery does not change much. Lets pretend that it does not change at all. If \(\mathrm{R}_\mathrm{Cu}\) is unchanged, but grade increases, this means that the \(\mathrm{R}_{\mathrm{SiO}_2}\) must have decreased. Keeping this assumption in mind, these points seem to make sense.
Obviously, this upward trend cannot continue forever. At the maximum \(\mathrm{Cu}\) grade, determined by the \(\mathrm{Cu}\) content in \(\mathrm{CuFeS}_2\), we would recover a speck of \(\mathrm{CuFeS}_2\), and no \(\mathrm{SiO}_2\). This would make \(\mathrm{SE} = \mathrm{R}_{\mathrm{Cu}} - \mathrm{R}_{\mathrm{SiO}_2} \approx 0-0\). Therefore the the true line connecting the \(\mathrm{SE}\) points may look something like this:
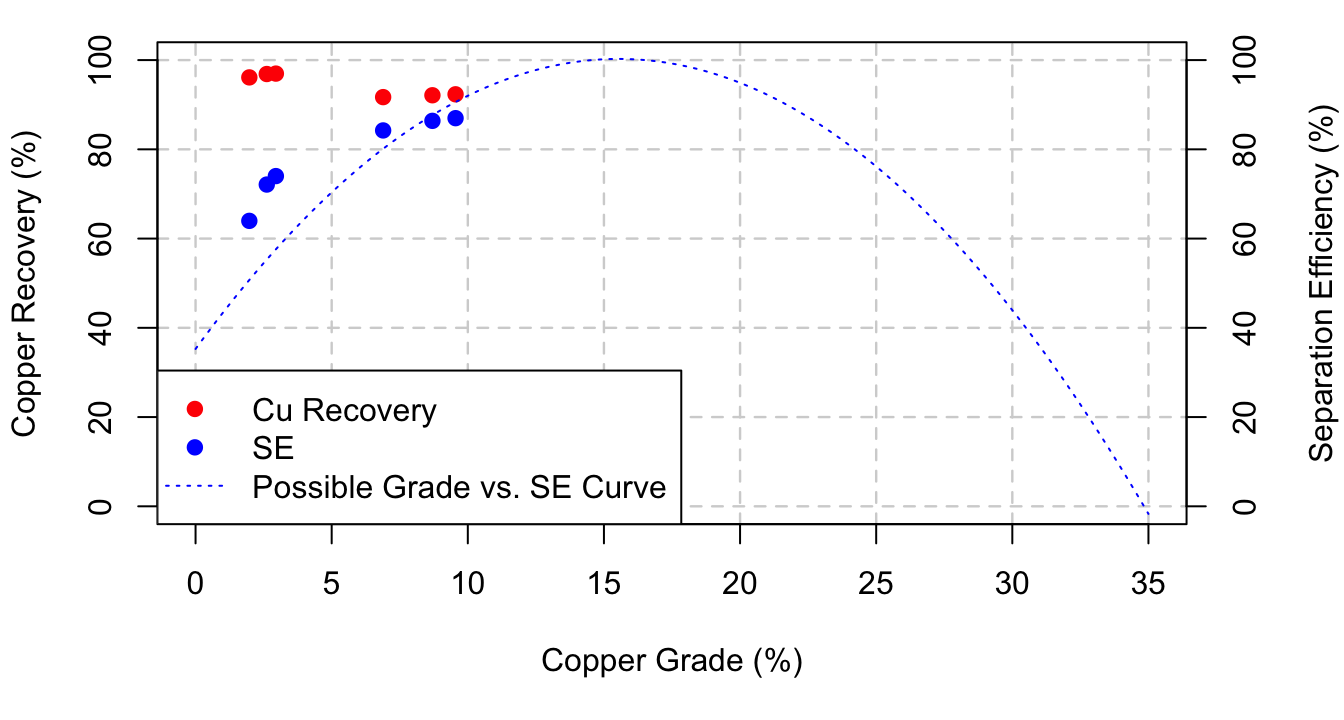
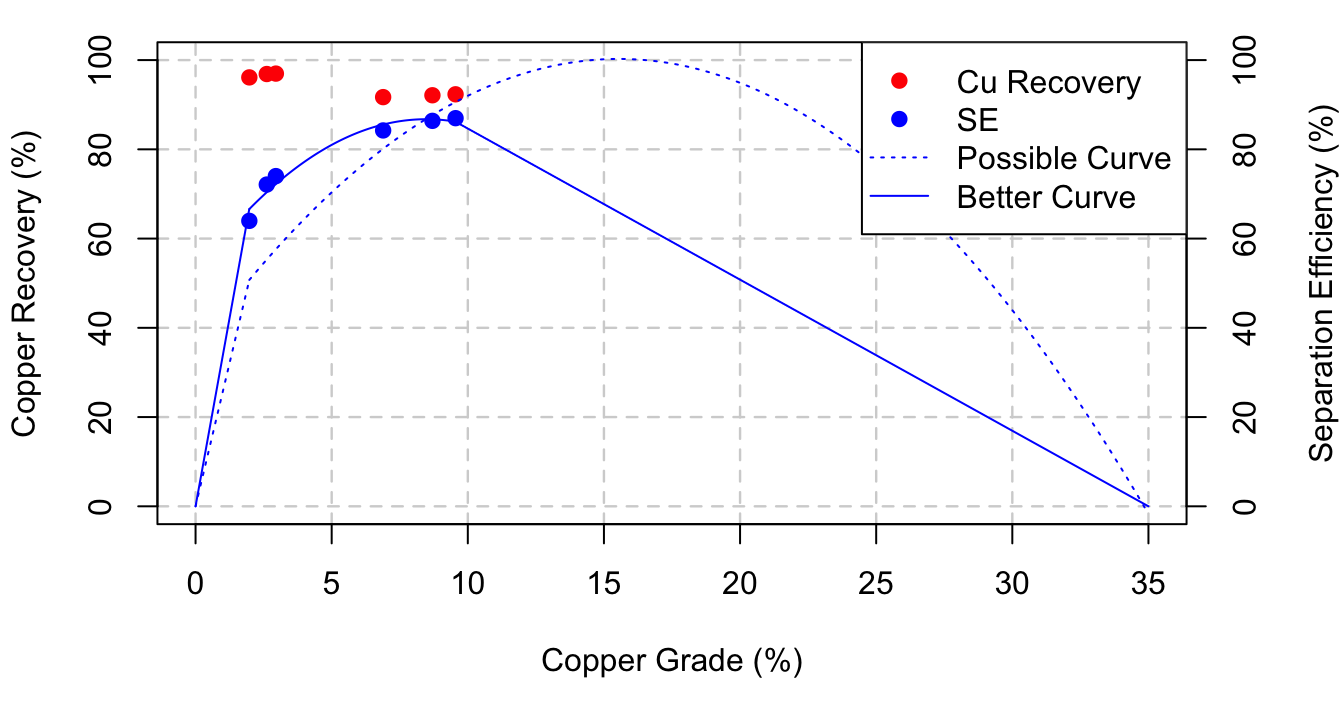
However, is the process actually going to get 100% recovery of copper? If so, can we really say at what grade? A more conservative approach, knowing the relationship between grade and \(\mathrm{SE}\) is shown below:
Plot 2
We know that:
\[ \mathrm{R}_{\mathrm{CuFeS}_2} = \mathrm{R}_{\mathrm{Cu}} \]
Because \(\mathrm{CuFeS}_2\) is the only copper containing mineral present. Keeping this in mind the resulting plot looks like:
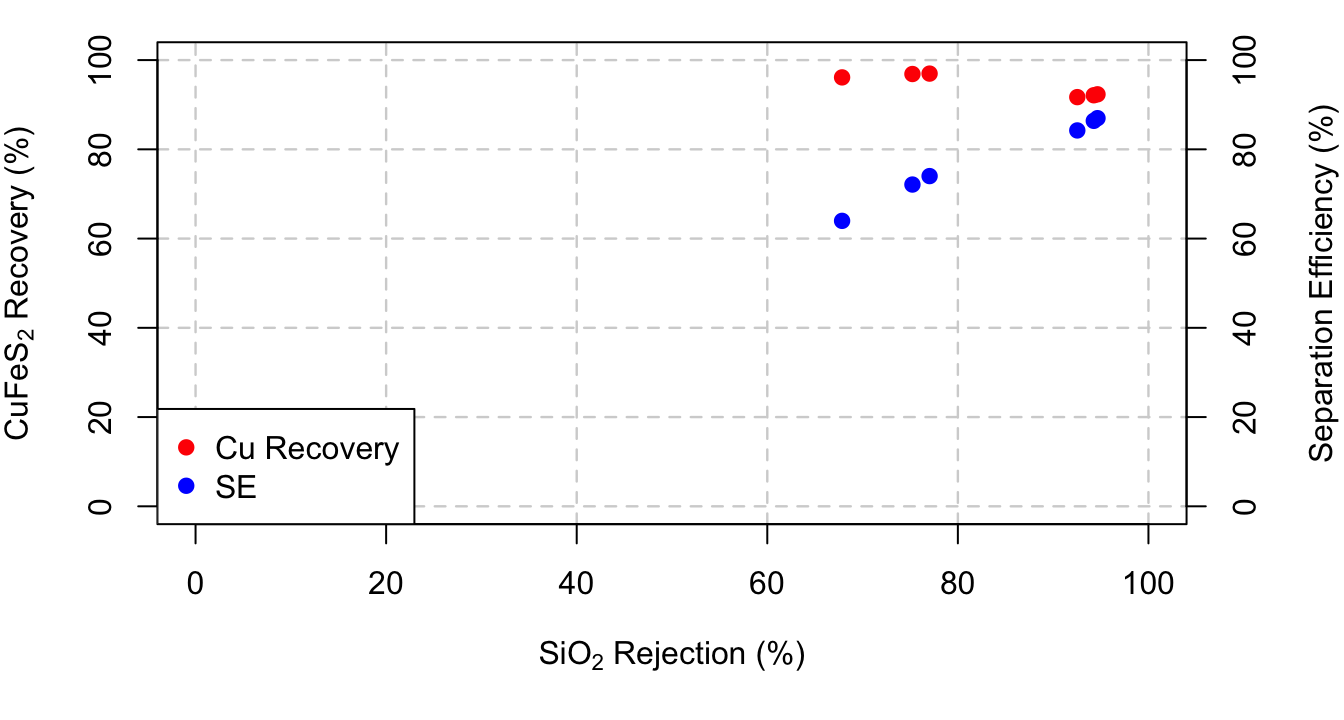
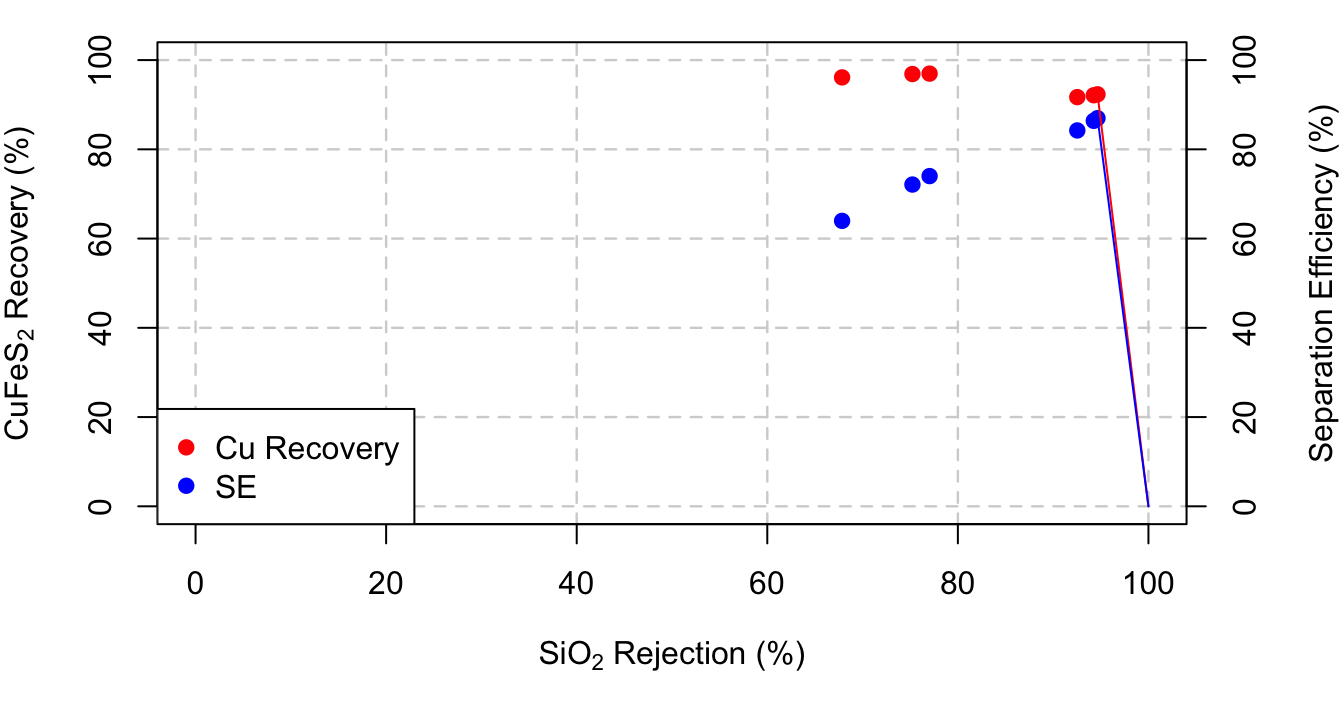
\(\mathrm{CuFeS}_2\) Recovery vs. \(\mathrm{SiO}_2\) Rejection
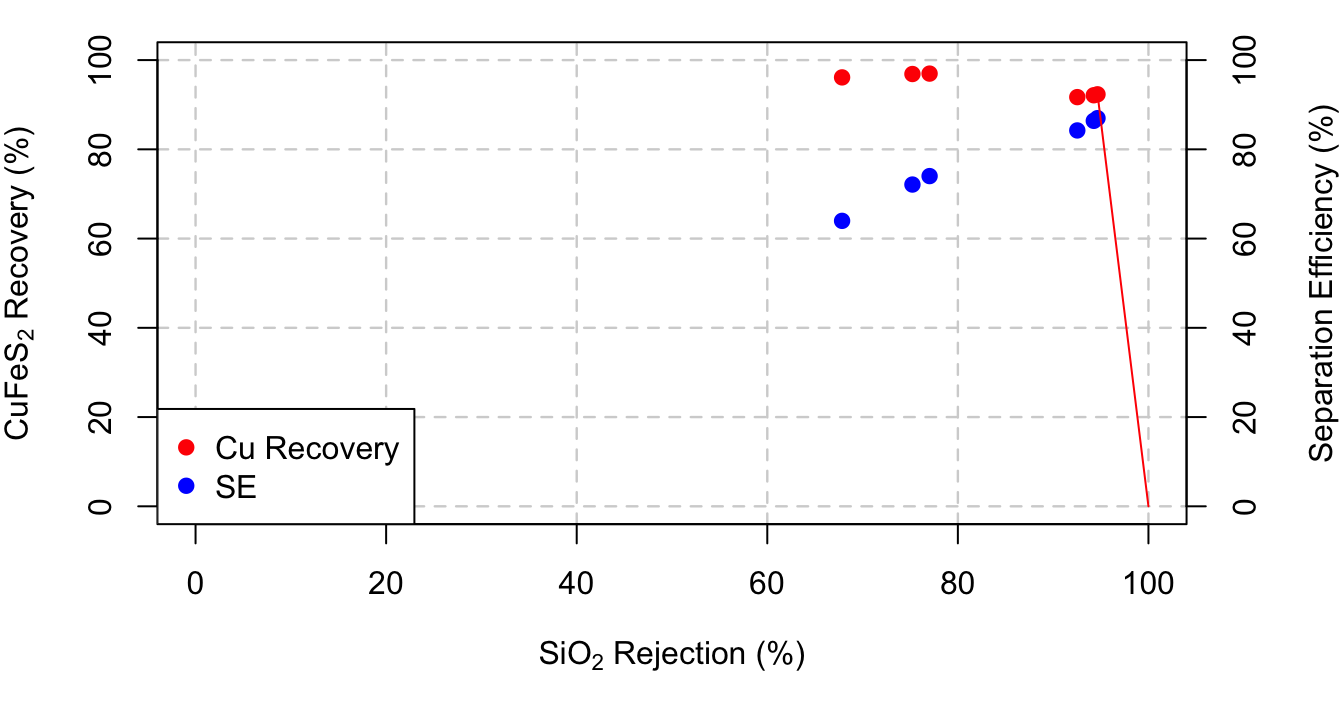
Similar to grade, vs. recovery, we know that as \(\mathrm{SiO}_2\) rejection increases, recovery will decrease. We see this trend in the data. However, we can only guess as to what happens for an \(\mathrm{SiO}_2\) rejection. It makes sense to draw a straight line from the last data point to \((100,0)\)
\(\mathrm{SE}\) vs. \(\mathrm{SiO}_2\) Rejection
We know that:
\(\mathrm{J}_{\mathrm{SiO}_2} = 100 - \mathrm{R}_{\mathrm{SiO}_2}\)
Where \(\mathrm{J}_x\) is the rejection of component \(x\). Therefore Equation \(\eqref{eq:SE}\) becomes:
\[ \begin{aligned} \mathrm{SE} &= \mathrm{R}_{\mathrm{CuFeS}_2} - \mathrm{R}_{\mathrm{SiO}_2}\\ & = \mathrm{R}_{\mathrm{CuFeS}_2} - (100-\mathrm{J}_{\mathrm{SiO}_2})\\ & = \mathrm{R}_{\mathrm{CuFeS}_2} + \mathrm{J}_{\mathrm{SiO}_2} - 100 \end{aligned} \]
The equation above shows that as \(\mathrm{SiO}_2\) rejection increases, \(\mathrm{SE}\) increases. However, we have to keep in mind the relationship between \(\mathrm{R}_{\mathrm{CuFeS}_2}\) and \(\mathrm{J}_{\mathrm{SiO}_2}\). When \(\mathrm{J}_{\mathrm{SiO}_2} \to 100\%\), \(\mathrm{R}_{\mathrm{CuFeS}_2} \to 0\%\), making:
\[ \begin{aligned} \mathrm{SE} & = \mathrm{R}_{\mathrm{CuFeS}_2} + \mathrm{J}_{\mathrm{SiO}_2} - 100\\ &= 0 + 100 - 100\\ & = 0 \% \end{aligned} \]
So we know that although \(\mathrm{SE}\) is trending upwards, the sudden downward change in recovery will cause \(\mathrm{SE}\) to eventually reach the point \((100,0)\). We don’t know when, but a good guess is to just draw a straight line.